Lint gutter
Compile diagnostics appear on the line that caused them, as you type — before you save.
ChartScriptBeta
ChartScript is TegoTrend's Pine-familiar, indicator-only scripting language. Write inputs, series math, plots, and shapes in a real code editor; run them sandboxed in your browser; share them on the Marketplace. Every save is validated again on the server.
The language
If you have written Pine Script, ChartScript reads like home. It deliberately stays an indicator language: it computes and draws, and order decisions stay with you.
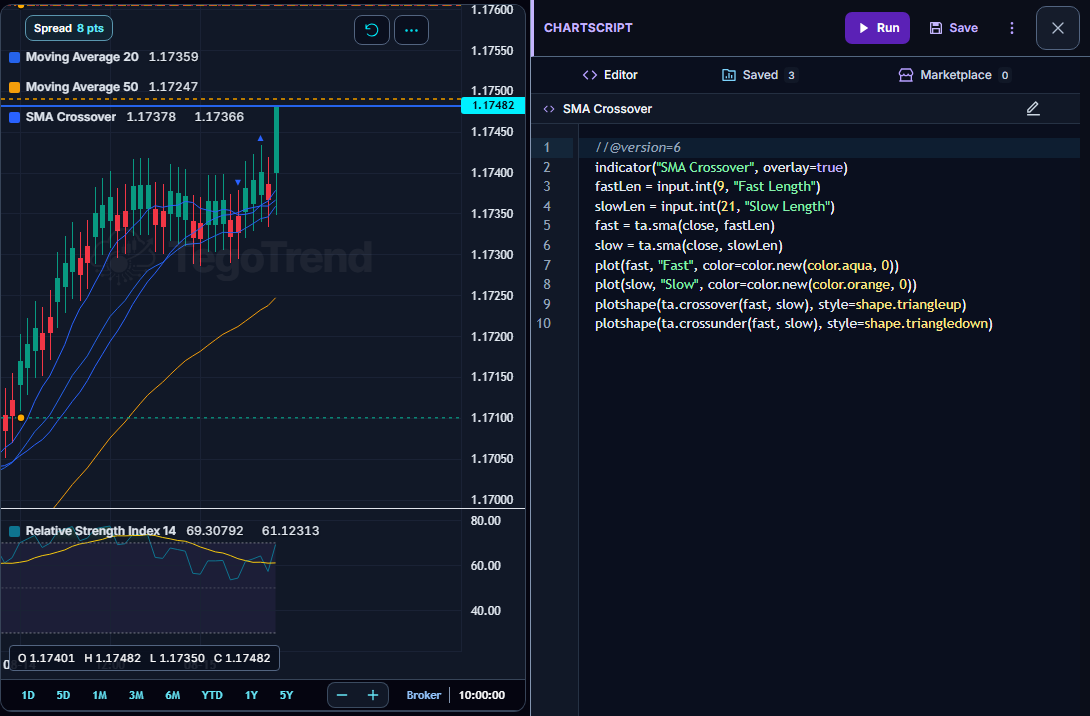
//@version=6indicator("SMA Crossover", overlay=true)fastLen = input.int(9, "Fast Length")slowLen = input.int(21, "Slow Length")fast = ta.sma(close, fastLen)slow = ta.sma(close, slowLen)plot(fast, "Fast", color=color.new(color.aqua, 0))plot(slow, "Slow", color=color.new(color.orange, 0))plotshape(ta.crossover(fast, slow), style=shape.triangleup)plotshape(ta.crossunder(fast, slow), style=shape.triangledown)The editor
ChartScript lives in a CodeMirror editor inside the workspace: diagnostics on the line, completions as you type, and the plot updating on the chart next to it.
Compile diagnostics appear on the line that caused them, as you type — before you save.
The Saved tab keeps your indicators beside the editor, with the libraries they import — up to 64 libraries.
Built-in functions, namespaces, constants, and your own inputs complete as you write.
Expand the editor over the chart when you are writing; collapse it when you are watching the plot.
Marketplace
The Marketplace tab sits inside the editor. Releases are immutable snapshots, installs are recompiled on the server, and nothing you install can place an order.
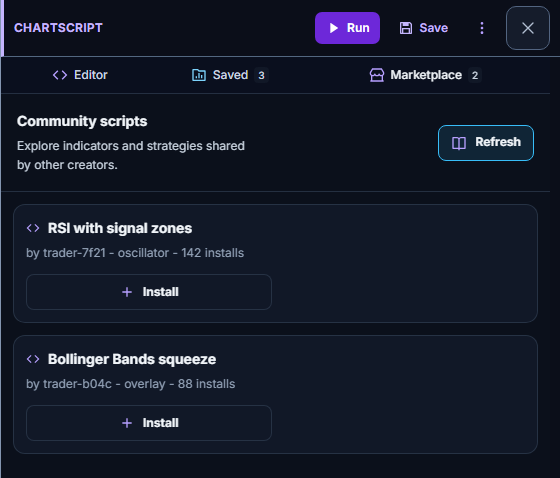
Shared releases list 25 at a time. Installing copies the source into your workspace, where the server recompiles it before it can run.
Publishing creates an immutable snapshot. Later edits become a new release — an installed copy never changes under someone else.
Withdraw a listing whenever you like. Your own scripts stay attached to your account either way.
Safety by construction
The limits are part of the design: your scripts get real computing power on real chart data, inside boundaries that protect your session and your account.
Scripts run in an isolated Web Worker with a hard 40-second compute cap — a runaway script stops itself, never your chart.
Every save is compiled and validated again on the server. The browser is never the final authority on what your account stores.
Scripts are capped at 512KB of source — room for serious indicators, no room for runaway payloads.
ChartScript is available on every plan — 1 saved on Free Trial, 3 saved on Starter, 15 saved on Pro, 50 saved on Gold (the same on Trader and AI Trader plans) — and your scripts stay attached to your account.
AI-generated market research — not investment advice. Always do your own analysis before trading.
Risk warning: Trading and investing involve substantial risk. You can lose some or all of the money committed, and leveraged or margined products may create losses greater than the initial amount deposited. Do not trade or invest money you cannot afford to lose.